How does aliasing occur in temporal signals?
Below, we have a sine wave with a fixed frequency. If this signal is sampled at an insufficient frequency, the following signal is produced:
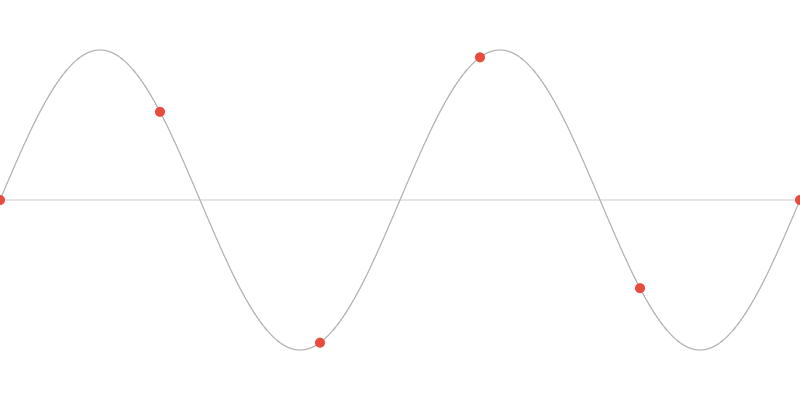
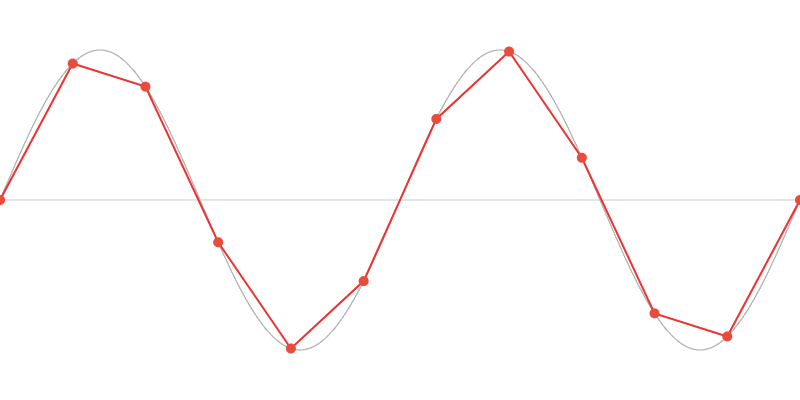
When the sampling points are connected or linearly interpolated, the following reconstructed signal emerges:

Doubling the sampling frequency results in the following signal. The sine wave is reconstructed more accurately:
When a sine wave with an increasing frequency is sampled, the aliasing effect becomes particularly evident in the higher frequency range, where multiple sine waves are reconstructed as a single wave:

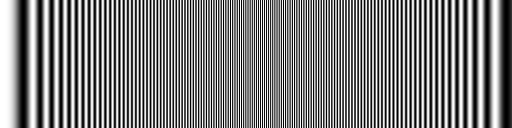
This effect is more clearly visible when representing the sine wave not as a transverse wave, but by depicting its amplitude in color. As in the last example, we have a sine wave with increasing frequency. Up to approximately the middle of the image, the original signal is still rendered correctly. In the right part of the image, aliasing artifacts are visible: